An amber heat health alert has been issued. It is in effect from from 8 July at 9am to 12 July 2026 at 9pm. Read about keeping safe in hot weather.
Air Quality Monitoring
Date updated: 28/01/2025
Air Pollution Monitoring
The City of London Corporation has been monitoring air quality in the City of London since the 1960s. Initially the focus was on sulphur dioxide and black smoke after the enactment of the Clean Air Act 1956.
The monitoring network has continually evolved in response to relevant legislation and the statutory requirements of London Local Air Quality Management to monitor, assess and take action to improve air quality.
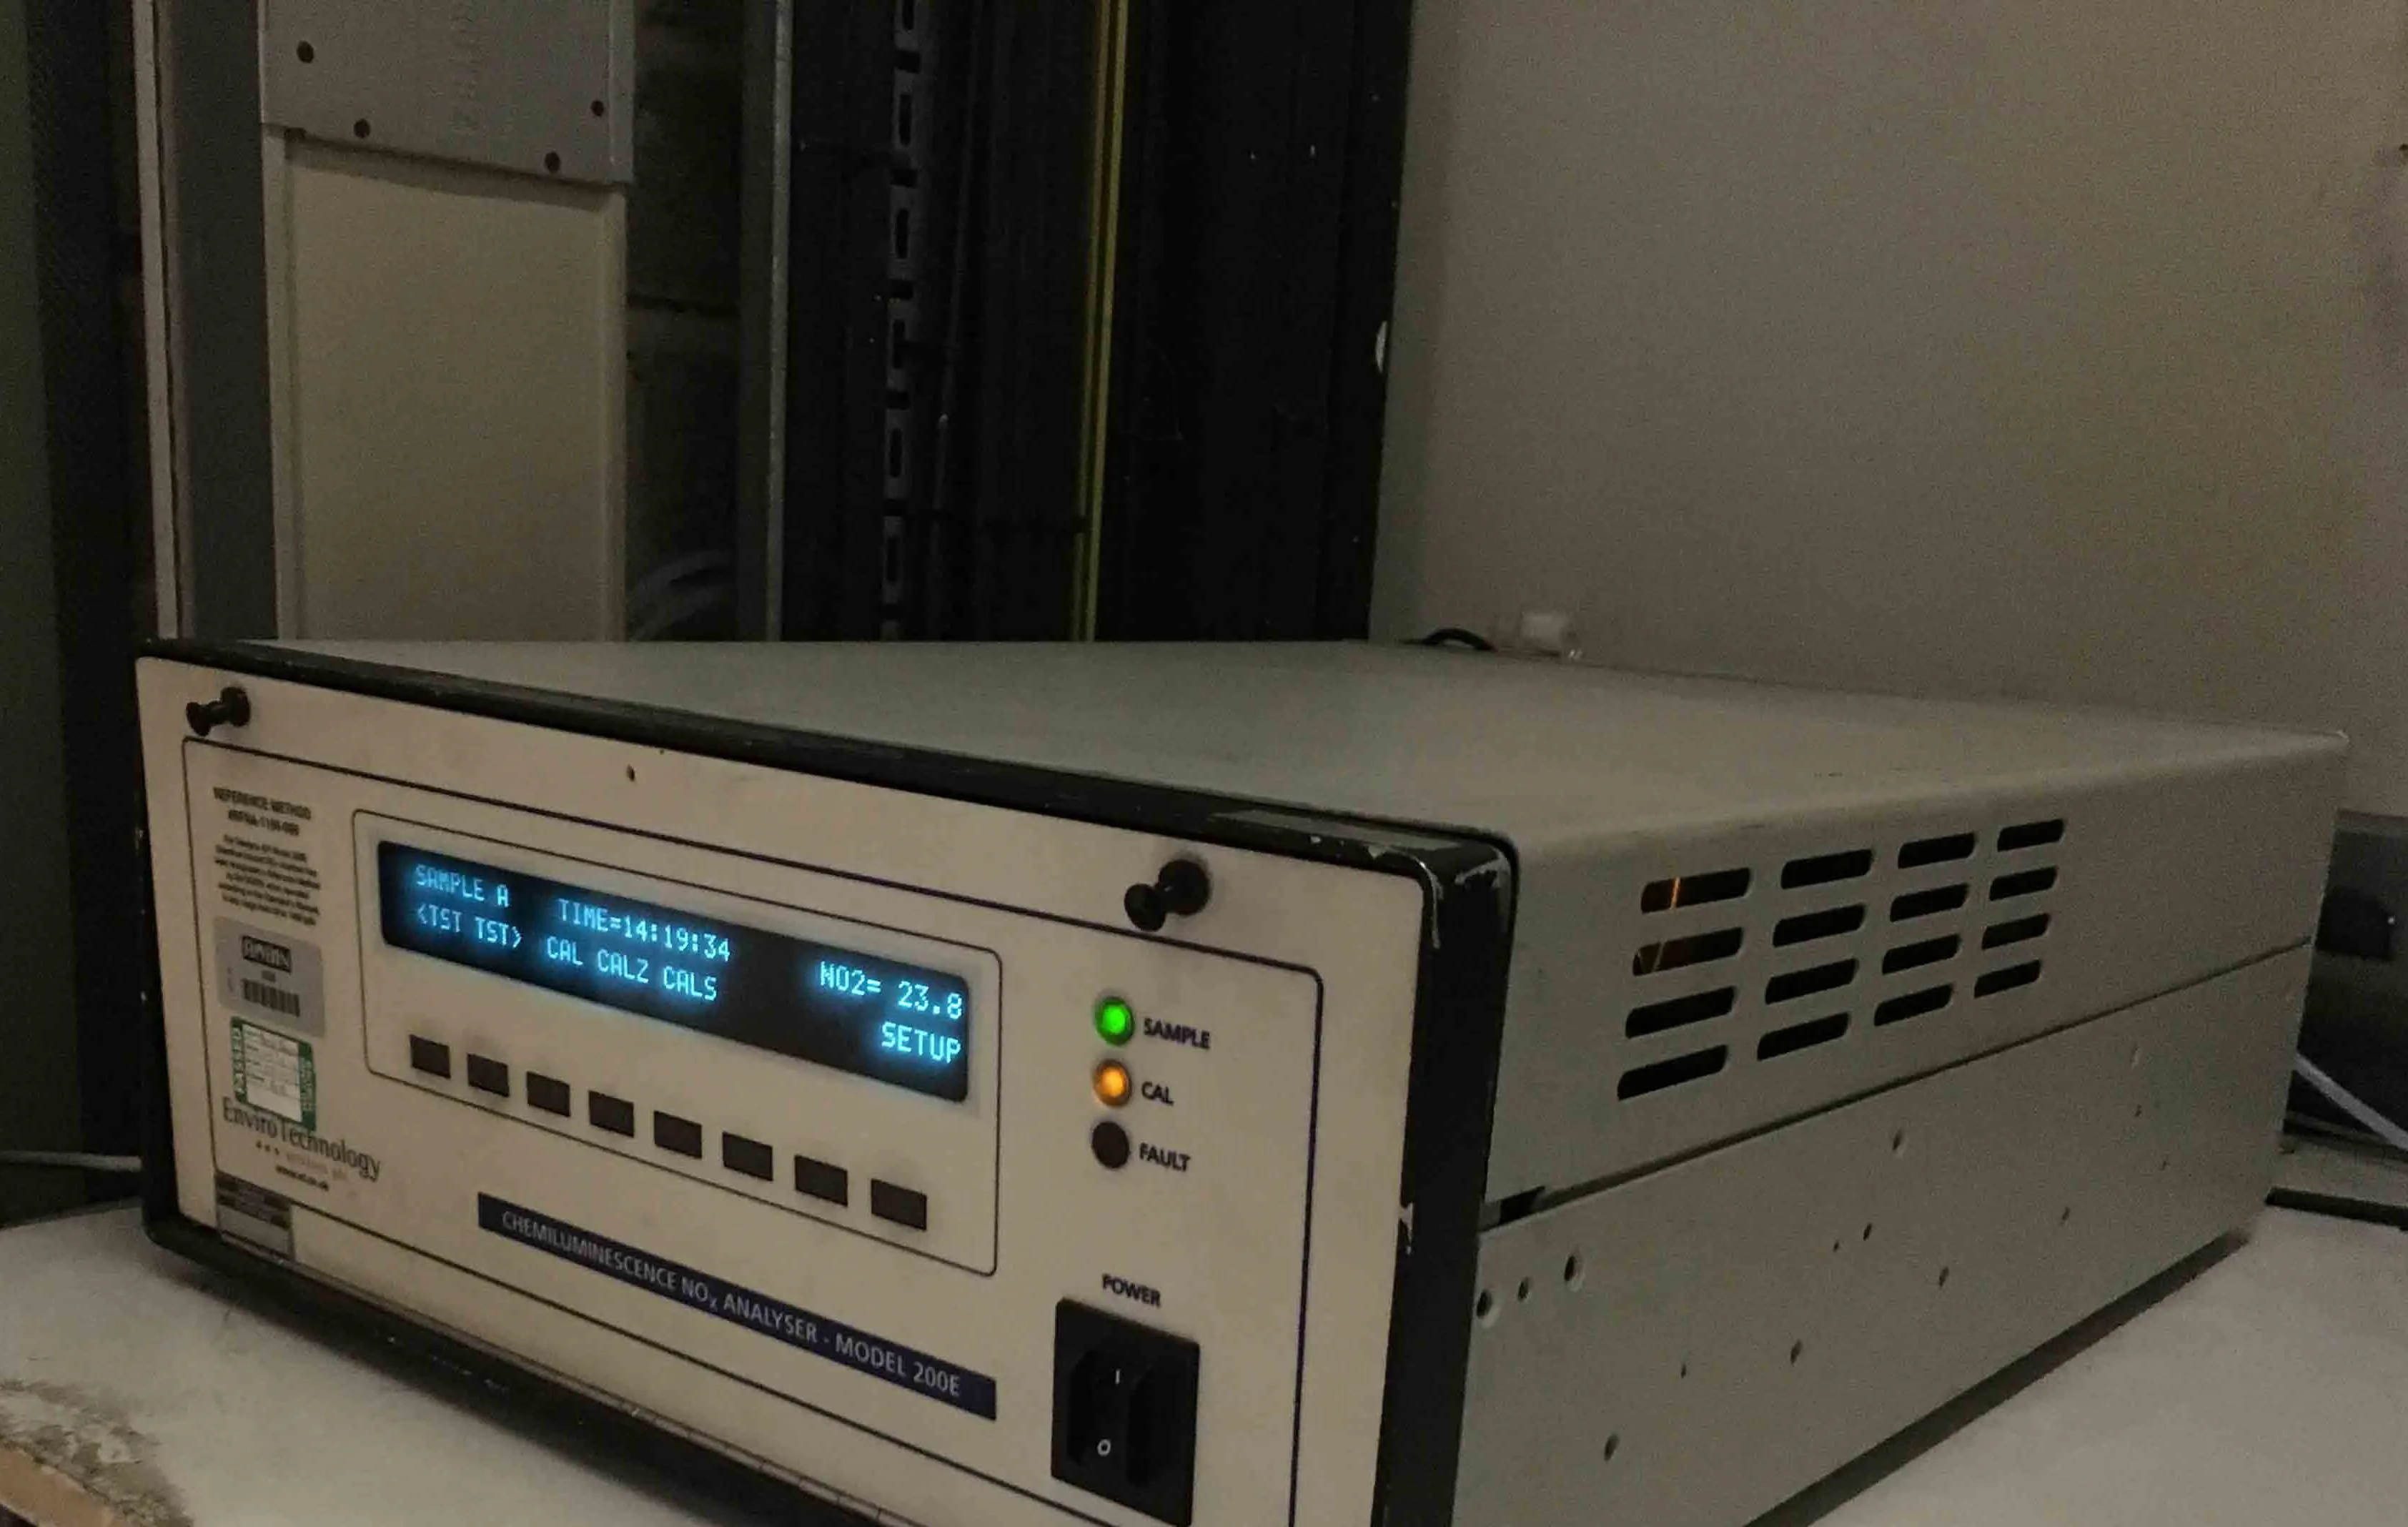
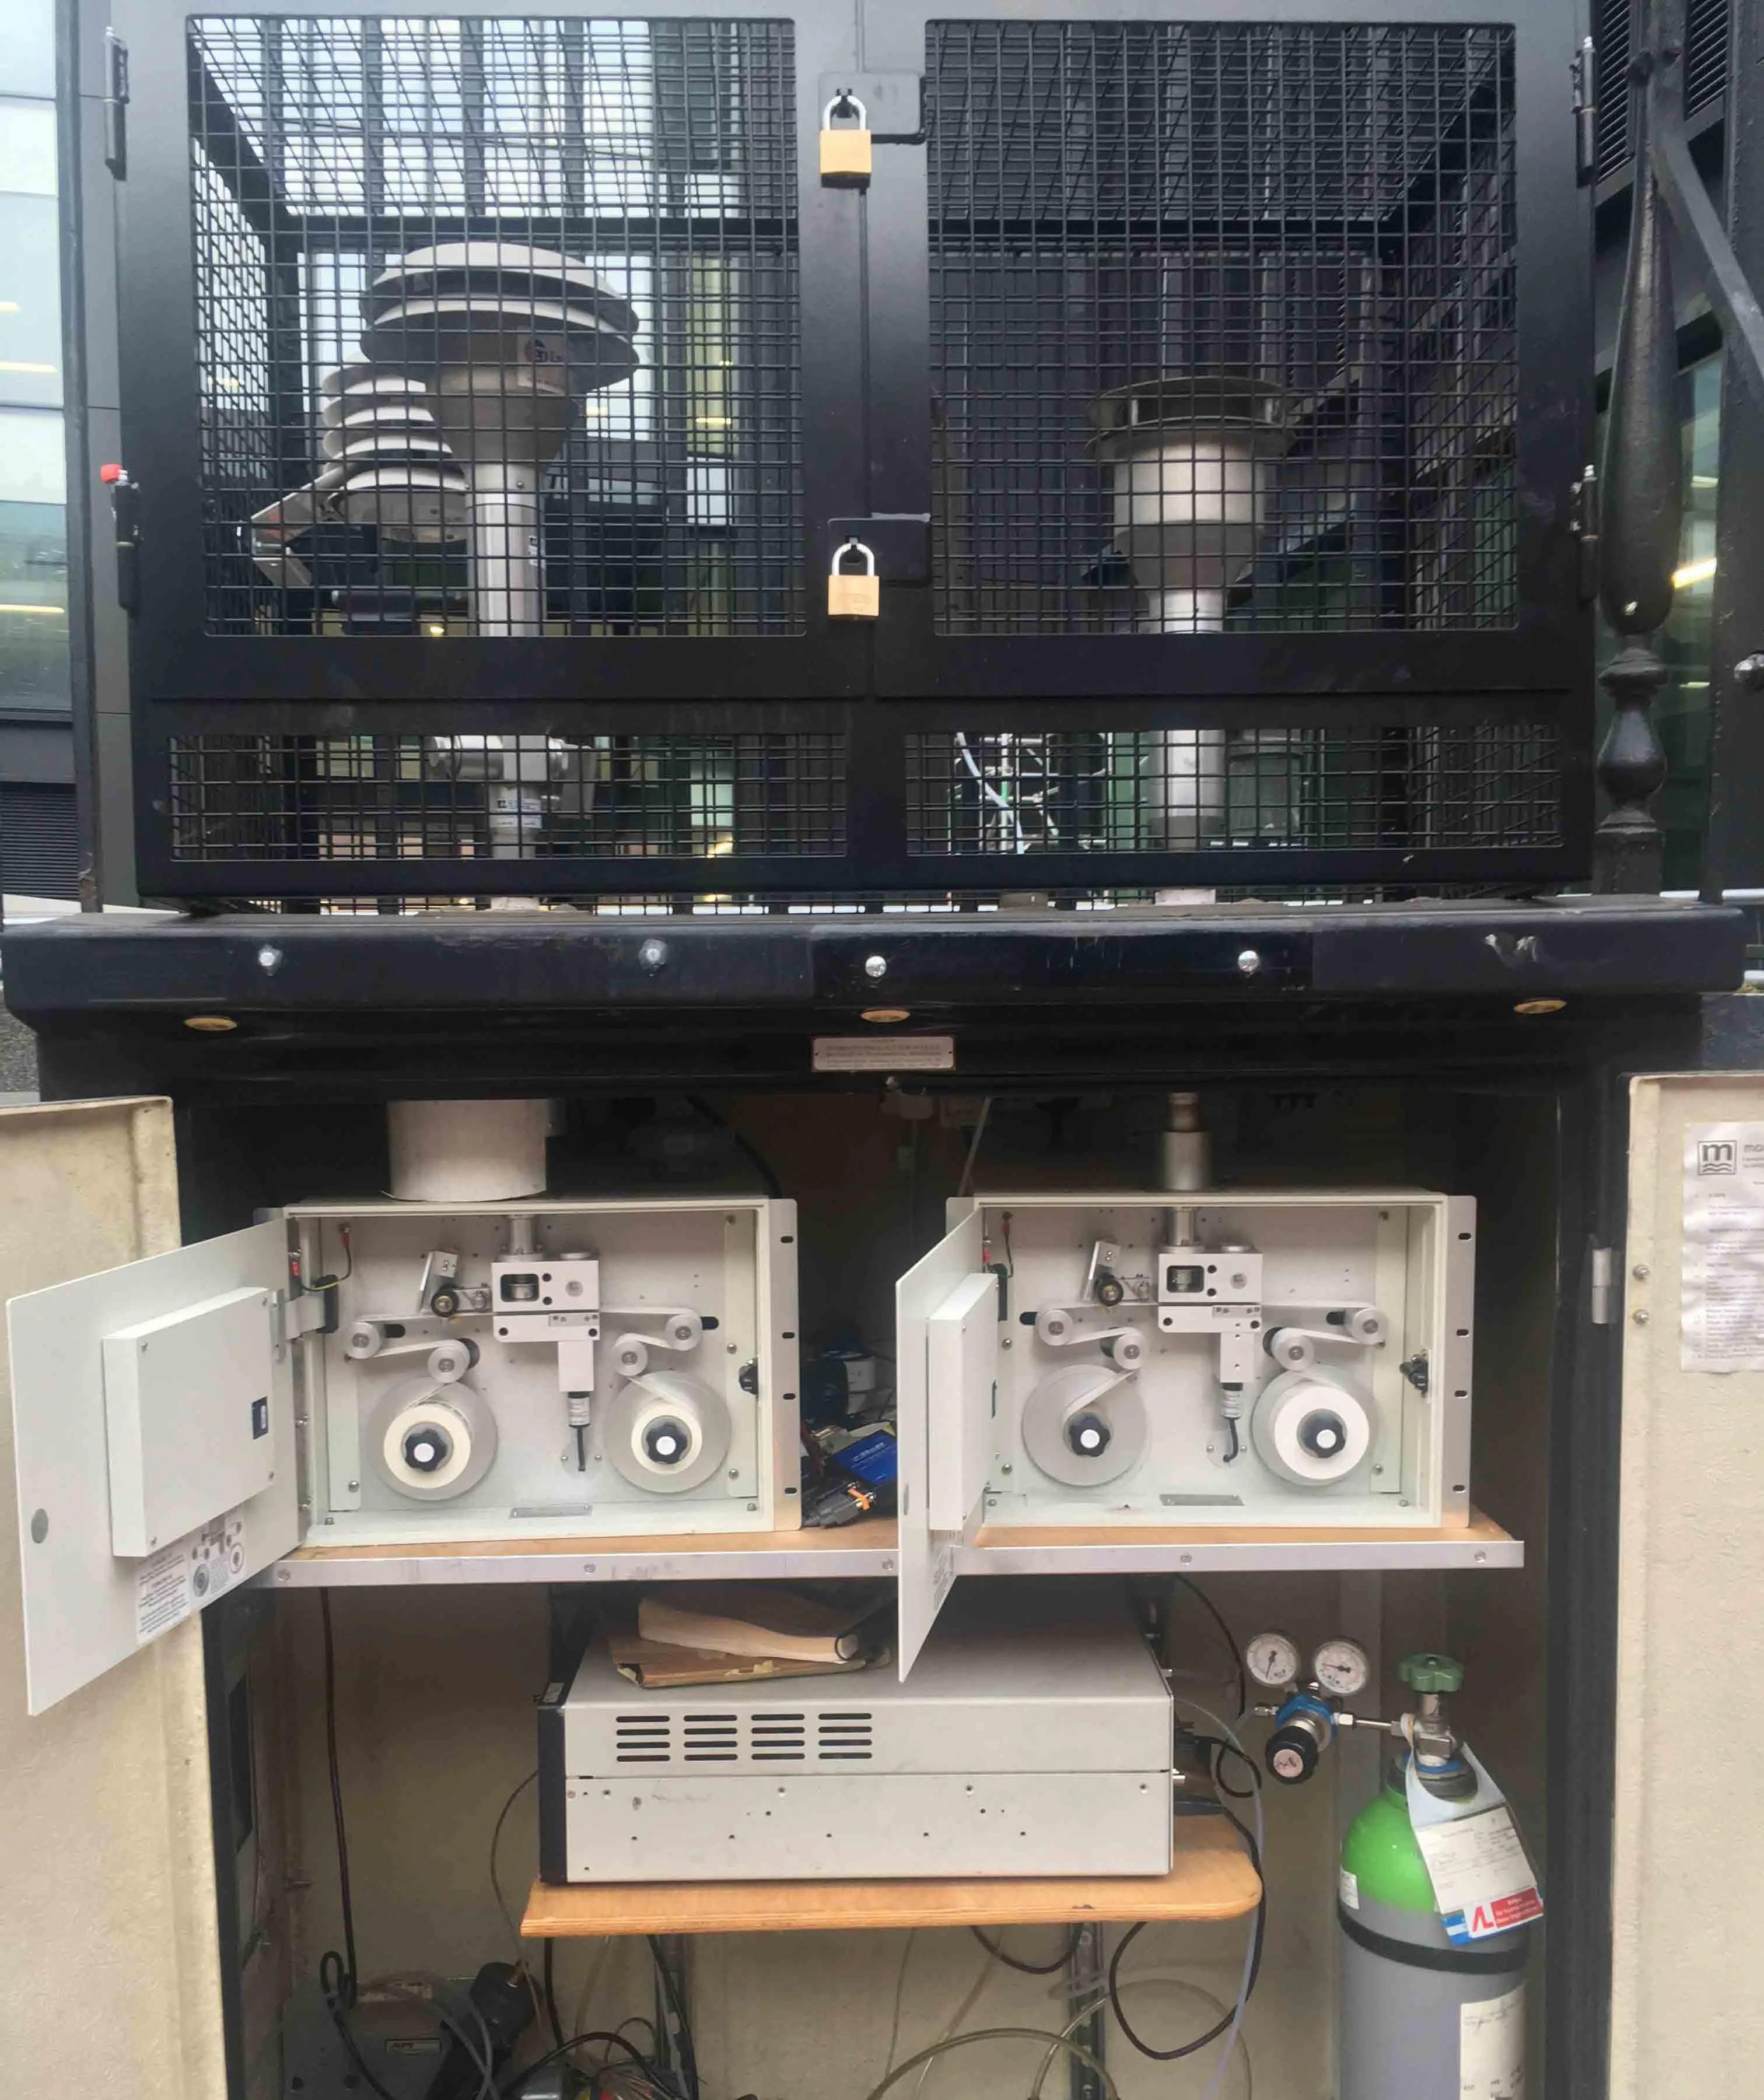
Automatic Continuous Monitoring
There are five locations within the City of London where sophisticated equipment is located to monitor air pollution. In addition to monitoring NO2 and PM10, monitoring of fine particulates (PM2.5) and ozone (O3) is also completed. The equipment monitors air pollution continuously, with a concentration provided every hour.
Two locations are 'urban background' sites. This allows the determination of long term trends in ambient air pollution as there is no immediate pollution source nearby. The remaining three other monitoring sites are 'roadside' sites.
- The Aldgate School, an urban background site (NO2, PM10 and PM2.5)
- Guildhall, an urban background site (O3)
- Beech Street, a roadside site (NO2 and PM10)
- Bell Wharf Lane, a roadside site (NO2 and PM10)
- Farringdon Street, a roadside site (PM2.5)
Details of the monitoring sites, including real-time and historic monitoring data, are available through the Air Quality in England website. Initially, provisional data is presented on the website. The data is subject to a rigorous system of auditing prior to being updated to ratified data, this process is completed in March for the previous year. Additionally, the monitoring data is presented via an air quality webtool. Air Aware has been developed for easier public dissemination of air quality data.
Annual statistics are presented within the City Corporation air quality Annual Status Reports.
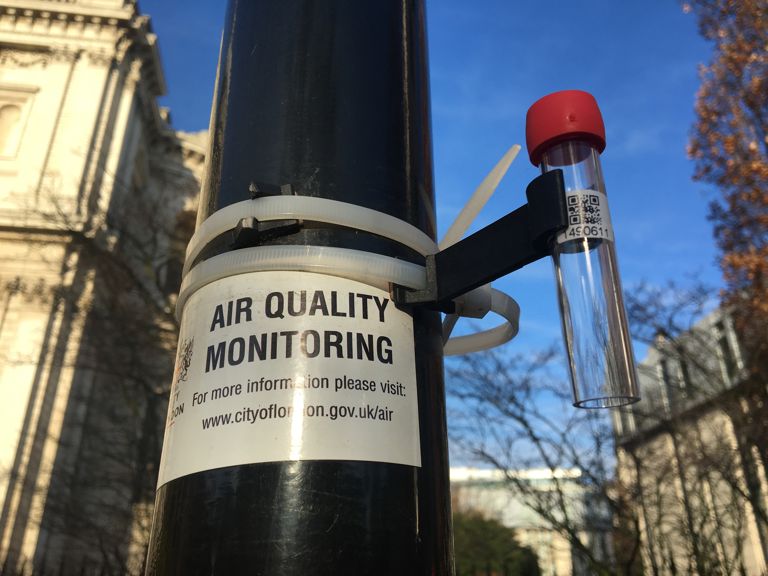
Passive NO2 Diffusion Tube Monitoring
Diffusion tubes are deployed at a number of locations across the City of London to monitor NO2. The tubes are exposed over a four/five week period and provide an indicative monthly average level of NO2 at each location.
The monthly monitoring data is processed to assess the annual mean concentration of NO2, and all data is included in the Annual Status Reports. The location of current diffusion tube monitoring and relevant concentrations are presented through the City Corporation Interactive Mapping resource.